


Gini Coefficient: Measuring Inequality in 2026
The Gini coefficient is a core metric used to quantify income and wealth inequality, ranging from 0 (perfect equality) to 1 (maximum inequality). As of 2026, global estimates indicate that wealth inequality remains structurally higher than income inequality, reflecting asset concentration trends across developed and emerging markets. The indicator is widely used by institutions such as the World Bank and the International Monetary Fund to assess economic balance, social stability, and long-term growth risks.
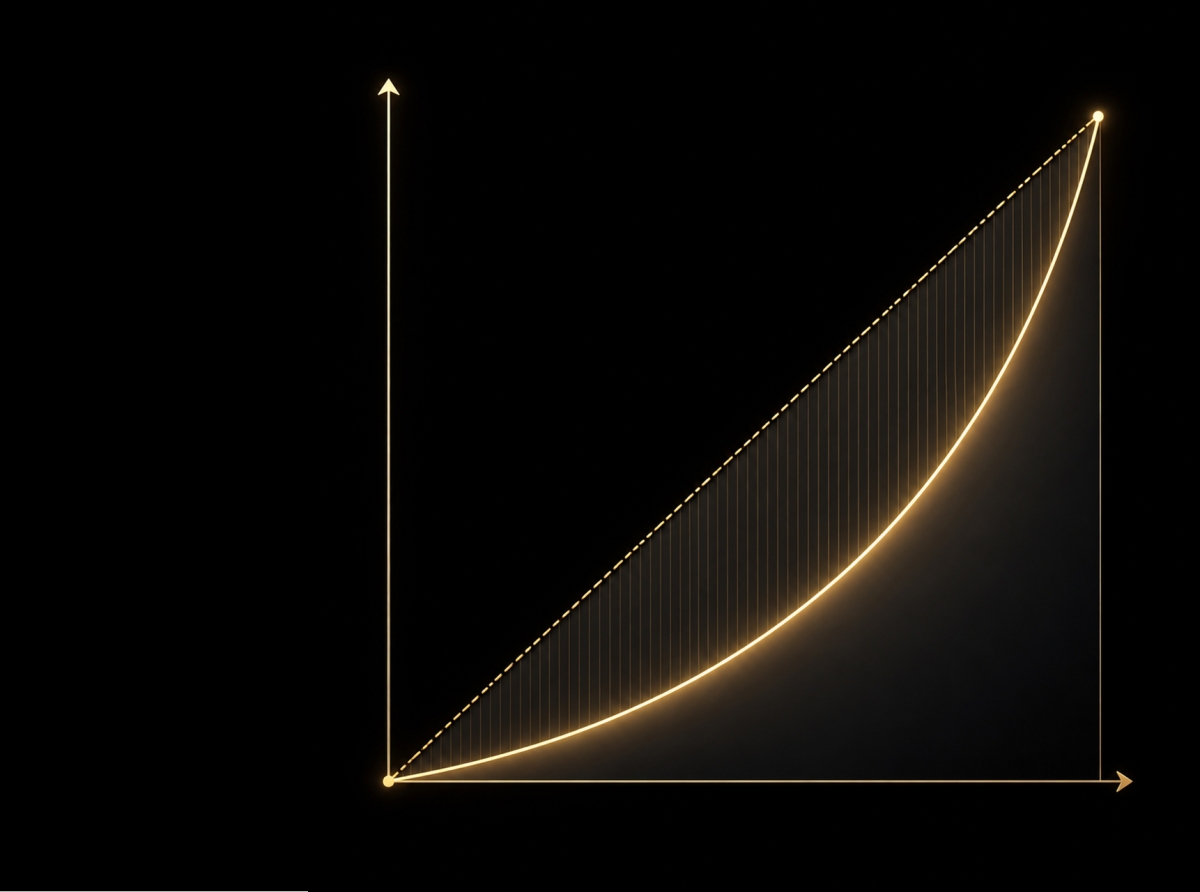
What the Gini coefficient actually measures
The concept was introduced in 1912 by Corrado Gini as a statistical way to capture how evenly income or wealth is distributed across a population. Instead of focusing on averages, the coefficient reflects dispersion—how far real distribution deviates from a perfectly equal scenario.A value close to zero indicates that income is distributed relatively evenly. A value approaching one signals high concentration, where a small share of the population controls a large portion of total resources. In applied economics, the indicator is often expressed as a percentage, commonly referred to as the Gini index.
Why inequality matters for markets
Inequality is not just a social issue; it is a structural economic variable. High Gini values correlate with differences in consumption patterns, savings rates, and capital allocation. In financial markets, this translates into uneven demand distribution and potential volatility in growth cycles.
From a macro perspective, economies with rising inequality may experience slower consumption growth, as a larger share of income accumulates among high-saving households. This dynamic influences everything from equity valuations to monetary policy decisions.
Income vs. wealth inequality
A critical distinction in 2026 analysis is between income and wealth. Income inequality measures annual earnings, while wealth inequality reflects accumulated assets such as real estate, equities, and business ownership.
Empirical observations show that wealth inequality tends to be significantly higher. Asset appreciation, especially in equities and real estate, amplifies disparities over time. This effect has been visible in the post-2020 market cycles, where capital markets outperformed wage growth.

Gini Coefficient: Measuring Inequality in 2026
Edge cases and extended interpretation
Although the Gini coefficient is typically bounded between 0 and 1, certain analytical models allow values beyond this range when accounting for negative income or debt-heavy balance sheets. These scenarios, while rare, highlight structural imbalances such as high household leverage.Such extensions are not standard in policy reporting but are used in academic contexts to stress-test inequality models under extreme conditions.
Historical data over the past two centuries indicates a broad increase in global inequality, particularly when measured through wealth distribution. Industrialization, globalization, and financialization have all contributed to this trend, concentrating capital while expanding overall economic output.
In recent years, technological acceleration—especially in AI and automation—has introduced a new layer. Capital-intensive industries benefit disproportionately, potentially widening the gap further.
Analytical perspective: why the Gini coefficient still matters
Despite its simplicity, the Gini coefficient remains one of the most widely used tools because it compresses complex distribution dynamics into a single comparable number. It allows cross-country analysis and time-series tracking without requiring granular data interpretation.However, it is not a complete measure. It does not capture structural nuances such as mobility, regional disparities, or access to services. For this reason, it is often used alongside complementary indicators.
The Gini coefficient provides a clear, standardized way to measure inequality and track its evolution over time. In 2026, its relevance extends beyond economics into financial markets and policy strategy, where distribution dynamics increasingly influence growth, stability, and investment flows.
By Claire Whitmore
May 15, 2026
Join us. Our Telegram: @forexturnkey
All to the point, no ads. A channel that doesn't tire you out, but pumps you up.
May 15, 2026
Join us. Our Telegram: @forexturnkey
All to the point, no ads. A channel that doesn't tire you out, but pumps you up.


Report
My comments