


Bitcoin Price Crash: Why BTC Is Trading 50% Below Its Record High
Bitcoin Price Crash: Why BTC Is Trading 50% Below Its Record High
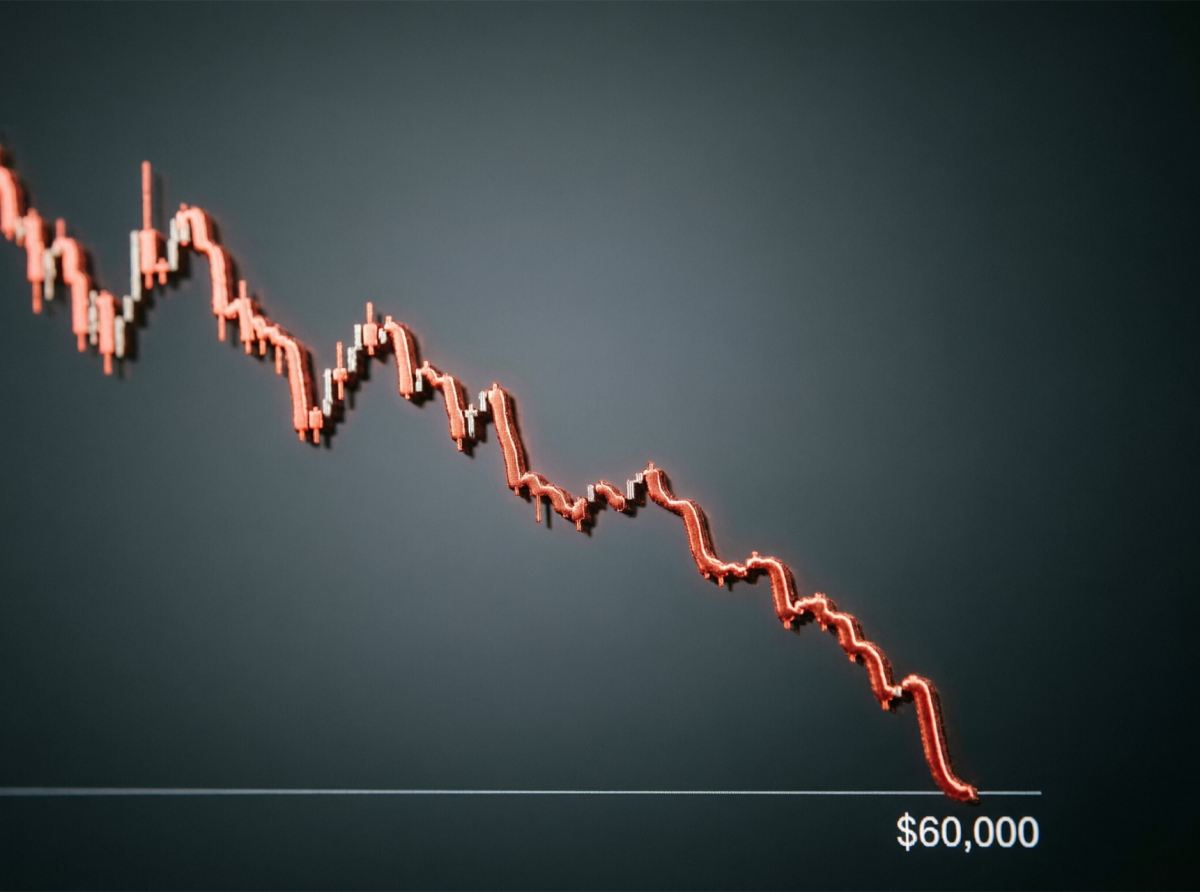
Bitcoin is trading near $62,500 in early June 2026, approximately 50% below its all-time high of $126,000 reached in October 2025. The decline has been driven by a combination of institutional selling, weaker momentum across the crypto market, investor rotation into AI-related equities, and growing uncertainty surrounding U.S. crypto legislation.
Market participants are also reassessing Bitcoin’s role as both a risk asset and a digital store of value as geopolitical tensions and changing capital flows reshape investor behavior. As of June 2026, the $60,000 level remains one of the most closely watched support zones in the cryptocurrency market.
Market participants are also reassessing Bitcoin’s role as both a risk asset and a digital store of value as geopolitical tensions and changing capital flows reshape investor behavior. As of June 2026, the $60,000 level remains one of the most closely watched support zones in the cryptocurrency market.
Why Bitcoin Is Under Pressure in June 2026
Bitcoin entered June with significant downside momentum and quickly extended losses. By the end of the first trading week, BTC was on track for a decline exceeding 16%, making it one of the weakest weekly performances since the beginning of the year.A key catalyst came from renewed selling pressure linked to crypto treasury company Strategy. Even though the company sold only a relatively small portion of its holdings, the move reminded investors that large institutional positions can still influence market sentiment. In highly leveraged environments, psychology often matters more than transaction size.
At the same time, broader risk markets experienced turbulence. Semiconductor stocks weakened after disappointing revenue expectations from a major industry player, triggering a wider reassessment of growth valuations. Because Bitcoin has increasingly traded alongside technology assets over the past several years, weakness in the tech sector quickly spilled over into digital assets.
From a trader’s desk, the reaction was familiar. Many short-term market participants expected aggressive dip-buying after the first wave of selling. Instead, bids remained shallow, and every minor rebound was met with fresh selling pressure. That absence of immediate buyers became a signal in itself.
The $60,000 Level Has Become the Market’s Psychological Battlefield
Technical levels often matter because enough traders believe they matter. For Bitcoin, the area around $60,000 has emerged as one of the most important zones on the chart.The market has not traded meaningfully below this threshold since September 2024. As a result, many portfolio managers, swing traders, and algorithmic systems view it as a key reference point for risk management decisions.
If Bitcoin holds above this region, investors may interpret the current decline as a deep correction within a broader cycle. A decisive break lower could trigger another wave of liquidations and force traders to reassess longer-term bullish assumptions.
Structured market data currently highlights the importance of this zone:
Bitcoin (BTC): approximately $62,500, June 2026, crypto spot market.
All-time high: $126,000, October 2025.
Current drawdown: approximately 50%.
Major support area: $60,000.
Previous visit below $60,000: September 2024.

Bitcoin Price Crash: Why BTC Is Trading 50% Below Its Record High
Capital Is Flowing Toward AI and Away From Crypto
One of the less discussed aspects of the current correction is competition for investor capital.During previous crypto bull markets, Bitcoin often benefited from excess liquidity searching for high-growth opportunities. In 2026, however, AI-related investments have become a dominant destination for speculative capital.
According to market participants, investors are increasingly allocating funds toward artificial intelligence infrastructure, semiconductor manufacturers, memory-chip producers, and upcoming technology listings. Retail traders who once chased crypto momentum are now finding alternative opportunities in equity markets.
This shift does not necessarily indicate a structural failure for Bitcoin. Instead, it reflects a changing investment landscape. Markets compete for attention, and attention frequently determines short-term capital flows.
A useful example can be found among active retail investors in Asia. During periods when technology stocks generate rapid gains, crypto trading volumes often decline as traders temporarily redirect capital toward sectors showing stronger momentum. The current environment appears to reflect that dynamic.
The Clarity Act Delay Removes a Major Bullish Catalyst
Regulation remains one of the most important long-term drivers of digital asset adoption.Many investors had expected progress on the U.S. crypto market structure legislation known as the Clarity Act. The bill was viewed as a potential framework for clearer oversight, regulatory certainty, and broader institutional participation.
Instead, legislative priorities have shifted, and disagreements among lawmakers continue to slow progress. The result is uncertainty.
For large asset managers, uncertainty increases risk premiums. For retail traders, it reduces enthusiasm. In both cases, delayed regulatory clarity can suppress demand.
The United States remains the largest institutional capital market for digital assets, but developments are also closely watched in the European Union, Singapore, Hong Kong, and emerging markets where crypto adoption continues to expand despite regulatory differences.
Is Bitcoin Still Digital Gold?
Perhaps the most important debate emerging from this correction concerns Bitcoin’s identity.For years, two dominant narratives have supported long-term bullish expectations. The first argues that Bitcoin functions as digital gold and should benefit during periods of geopolitical uncertainty. The second suggests Bitcoin behaves like a high-beta technology asset that rises when growth stocks rally.
Recent market action challenges both assumptions.
While geopolitical tensions have remained elevated, Bitcoin has struggled to attract safe-haven demand. At the same time, major equity indexes have continued reaching record levels while Bitcoin has lagged behind.
This divergence raises important questions. If Bitcoin is not consistently behaving like a hedge and is not fully participating in equity market rallies, investors must determine which valuation framework should guide future expectations.
In practice, many retail traders make the mistake of searching for a single narrative. Financial markets rarely operate that way. Bitcoin can behave like a risk asset during one cycle, a macro hedge during another, and a liquidity-driven speculation vehicle during a third.
Could This Become Another Historic Buying Opportunity?
Despite the negative sentiment, not all market participants are bearish.Several analysts point to Bitcoin’s long-term technical structure and argue that previous visits to major moving-average support zones have historically created attractive entry opportunities.
History, however, does not guarantee repetition. Each cycle develops under different liquidity conditions, regulatory environments, and investor behavior patterns.
What appears clear is that the market is approaching an important decision point. A successful defense of the $60,000 region could restore confidence and encourage long-term accumulation. Failure to hold support may lead to additional volatility before a durable bottom emerges.
For traders, the lesson is straightforward. The current environment is less about predicting headlines and more about monitoring capital flows, institutional behavior, regulatory developments, and risk sentiment across global markets.
Bitcoin’s decline to nearly 50% below its October 2025 record reflects more than a simple technical correction. Institutional selling, competition from AI-driven investments, delayed regulatory progress, and changing investor expectations have combined to create one of the most challenging environments for BTC in recent years. Whether the $60,000 level becomes a foundation for recovery or a gateway to deeper losses will likely define the next phase of the crypto market cycle.
Written by Ethan Blake
Independent researcher, fintech consultant, and market analyst.
June 05, 2026
Join us. Our Telegram: @forexturnkey
All to the point, no ads. A channel that doesn't tire you out, but pumps you up.
Independent researcher, fintech consultant, and market analyst.
June 05, 2026
Join us. Our Telegram: @forexturnkey
All to the point, no ads. A channel that doesn't tire you out, but pumps you up.


Report
My comments